Wiki
Signal Processing
Tue 3 Nov 2020 05:56 PET
- Getting the voice signal
- Designing the digital filter
- Convoluting
- Espectral inversion
- Plotting the original voice signal
- Aplying the filter to the signal
- Plotting the filtered voice signal
- Finals results
Designing a simple voice filter using Python
A simple code written in Python, without using filter libraries.
T
his posts explains how to design a voice filter, specifying a cutoff frecuency, and the sample rate, getting the audio signal, and designing the filter using the well-known Blackman window, then make and spectral inversion of the filter to obtain the desired filter (high-pass filter), and finally plotting the original and filtered voice signal.
Getting the audio.
I used the sounddevice as library because it has a few convenience functions to play and record arrays containing audio signals. And of course is available for Linux, macOS and Windows.
You can find the documentation here!
#First it's necessary to specify the samplerate and the duration
fs=20000
seconds=5

#Start the recording
myrecording = sd.rec(int(seconds*fs),samplerate=fs,channels=1)

#Wait to finish the recording
sd.wait()

#Writting the output in the current directory
write('input.wav',fs,myrecording)

#Reading the ouput from the path where the file was stored
samplerate,data=wavfile.read('/path/to/the/file')
length=data.shape[0]/samplerate
Designing the digital filter
We must specify the cut frecuency, to work with, also the transition bandwidth, as say before we are using Blackman window, that is a window function, that is zero-valued outside of some chosen interval, choosing as N=51, then to create an array of N elements, ,we need to create the window and sine cardinal function.
#specifying the cut frecuency
cutFrec=250

#formatting the cut frecuency according with the sample rate
fc = cutFrec/fs

#transition band
b = 0.08

#N must be odd
N = int(np.ceil((4/b))

#changing the value if N is even
if not N % 2: N += 1
n = np.arange(N)

#creating the cardinal sine
h = np.sinc(2*fc*(N - 1) / 2))

#creating the Blackman windows
w = 0.42 - 0.5 * np.cos(2 * np.pi * n / (N - 1)) + 0.08 * np.cos(4 * np.pi * n / (N - 1))
Convoluting
The filter is simply the convolution of the two preceding expressions, "h" and "w", multiplying sinc filter by blackman window, and then normalizing to get 1 as unity gain.
#convoluting the sinc filter and blackman window
h = h * w

#normalizing
h = h / np.sum(h)
Espectral inversion
The procedure to create the desired filter, is to invert the signal, using spectral inversion to convert it into a high-pass filter, starting from the cutoff frecuency and the transition bandwidth, and the procedure to do this, is changing the sign of each value of the filter, then adding one the the value in the center.
#inverting
h = -h

#adding one to the value in the center
h[(N-1)//2] +=1
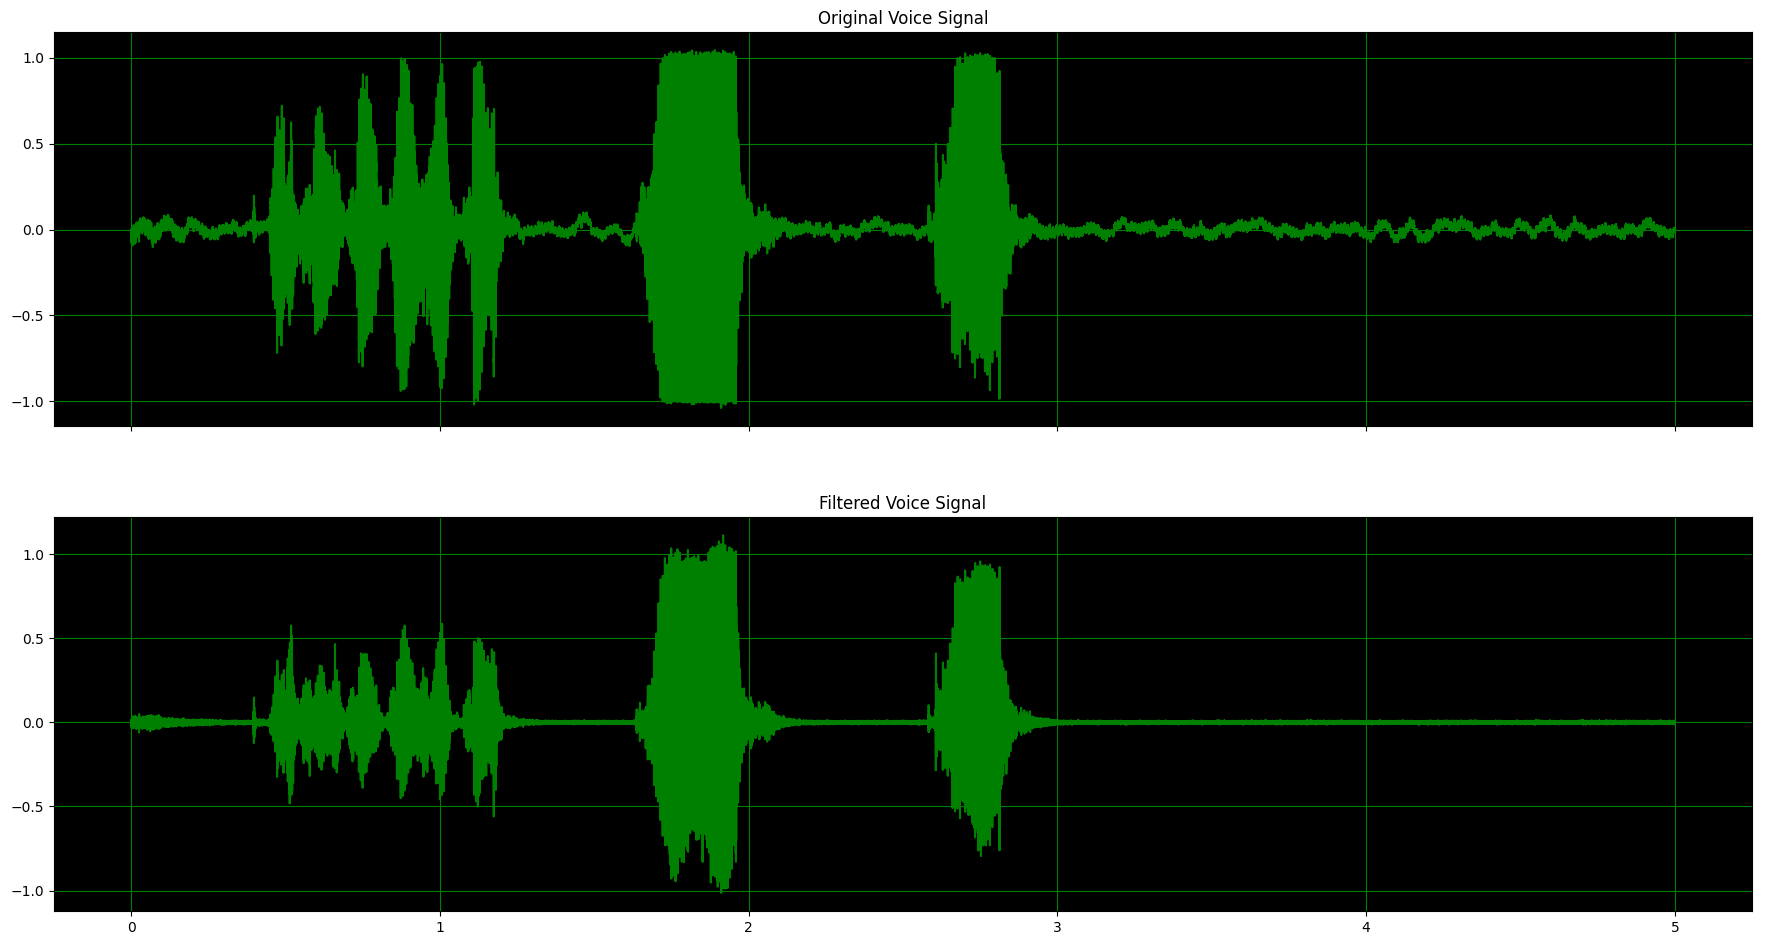
Plotting the original voice signal
Using Matplotlib to plot the signal, helping us to creating static, animated and interactive visualization in Python
You can find the documentation here
#creating an array
t = np.linspace(0.,length,data.shape[0])

#creating subplots ax1 and ax2
fig,(ax1,ax2) = plt.subplots(2,1,sharex=True)

#plotting time vs signal
ax1.plot(t,signal,"g")

#setting a title
ax1.set_title('Original Voice Signal')

#background color
ax1.patch.set_facecolor('black')

#grid
ax1.grid(color="g")
Aplying the filter to the signal
Now its necessary to convolve the filter with the original voice signal, optionally we can write the output in the current directory
#convolving
signalFiltered=np.convolve(data,h,'same')

#writing the output
write('filteredOutput.wav',fs,signalFiltered)
Plotting the filtered voice signal
Now, we have to plot the filtered signal vs time, setting the title, background color and the grid
#plot time vs filtered signal
ax2.plot(t,sig)

#setting title
ax2.set_title('Filtered Voice Signal')

#setting background
ax2.patch.set_facecolor('black')

#setting grid
ax2.grid(color="g")

#show the plot
plt.show()
Final results
As we can see, the filter is working as expected, filtering all signal below 250Hz